We make use of two implementations of Directed Point to demonstrate how our communication model could be used for performance evaluation and analysis. As the model parameters represent some forms of software overheads and hardware latency, changes in communication hardware and software are being revealed by the changes in these model parameters. This gives us better insights on the performance impacts of various design choices.
We have two clusters that are driven by two different Ethernet implementations of Directed Point, one is a Fast Ethernet cluster (FEDP) and the other is a Gigabit Ethernet cluster (GEDP). The FEDP cluster consists of 16 PCs running Linux 2.0.36. Each node is equipped with a 450MHz Pentium III processor with 512 KB L2 cache, a Intel 440BX PIIX4e chipset that supports a 66/100 MHz system bus, 128 MB of PC100 SDRAM, and uses a Digital 21140A Fast Ethernet adapter for high-speed communication. The whole cluster is connected to a 24-port IBM 8275-326 Fast Ethernet switch which has 5 Gbps backplane capacity. For the GEDP cluster, it consists of four Dell PowerEdge 6300 SMP servers with four Pentium III Xeon processors sharing 1 GB of EDO memory. The Xeon processor consists of 512KB L2 cache and operates at 500 MHz. This Dell system is using the Intel 450NX controller chipset with a 100 MHz front-side bus and has 64-bit 33 MHz PCI slots for the interconnects. All servers are running on Linux 2.2.12 kernel. In addition, each server is equipped with one Packet Engine G-NIC II Gigabit Ethernet adapter, and is connected to the Packet Engine PowerRail 2200 Gigabit Ethernet switch, which has a backplane capacity of 22 Gbps.
To review the performance issues related to high-speed communication, we have performed a series of microbenchmark tests on these clusters. To achieve beyond-microsecond precision, all timing measurements are calculated by using the hardware time-stamp counters in the Intel Pentium processors. If applicable, all data presented in this section are derived from a statistical calculation with multiple iterations of the same benchmark routine. Each test is conducted with at least 200 iterations with the first and last 10% of the measured timing excluded. Only the middle 80% of the timings is used to calculate the average.
By executing the associated benchmark routines (Appendix A), we construct a set of model parameters for the two clusters, as shown in Figure 3.1. In the figure, there are two sets of parameters for the Gigabit Ethernet implementation (GEDP), one is obtained when using an SMP kernel, i.e. with the SMP support on the Linux 2.2.12 kernel (GEDP-SMP), and the other is without SMP support (GEDP-UP), i.e. uni-processor mode on an SMP server. The purpose of this comparison is to reveal the differences in performance with respect to different OS modes and hardware platforms.
|
[Send overhead:
 [Asynchronous receive overhead: [Asynchronous receive overhead: 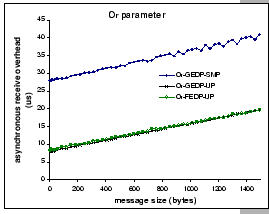
[User receive overhead:
 [Network latency: [Network latency: 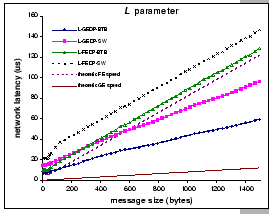
[Inter-packet transmit gap:
 [Inter-packet receive gap: [Inter-packet receive gap: 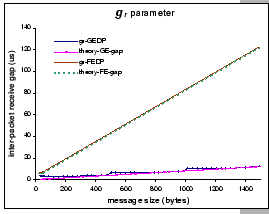
|
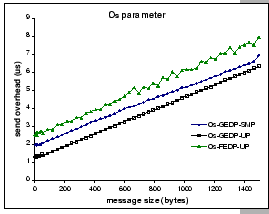
With DP messaging library, the ![]() parameter reflects the
time used by the host CPU to initiate the transmission while performing
the send (dp_write()) operation. Figure 3.1(a)
shows the cost associated with the dp_write() operation. It
involves a lightweight system call and a cross-domain data movement.
We see that the processor speed does affect the software cost with
500MHz Xeon processor performs marginally better than the 450MHz Pentium
III processor, as both hardware platforms are operated with a 100
MHz system bus. However, the prevailing software cost of the
parameter reflects the
time used by the host CPU to initiate the transmission while performing
the send (dp_write()) operation. Figure 3.1(a)
shows the cost associated with the dp_write() operation. It
involves a lightweight system call and a cross-domain data movement.
We see that the processor speed does affect the software cost with
500MHz Xeon processor performs marginally better than the 450MHz Pentium
III processor, as both hardware platforms are operated with a 100
MHz system bus. However, the prevailing software cost of the ![]() parameter is coming from the data movement overhead in the send operation.
We believe that with the DP protocol, any improvement in processor
speed would be offset by the data movement cost; hence, using a system
with a faster system bus and memory subsystem would benefit most.
parameter is coming from the data movement overhead in the send operation.
We believe that with the DP protocol, any improvement in processor
speed would be offset by the data movement cost; hence, using a system
with a faster system bus and memory subsystem would benefit most.
Nevertheless, we see that DP still manages to minimize the send overhead
and achieve good performance in driving both networks, especially
it looks promising on the Gigabit communication. For example, the
cost to send a full-size Ethernet packet is about 7 ![]() under
the SMP OS, while the theoretical speed in transmitting such an Ethernet
packet under Gigabit performance is around 12.3
under
the SMP OS, while the theoretical speed in transmitting such an Ethernet
packet under Gigabit performance is around 12.3 ![]() . Therefore,
an active sending process could saturate the network by continuous
transmission. Lastly, observed from the GEDP measurements, with the
SMP mode, there is an extra 0.5
. Therefore,
an active sending process could saturate the network by continuous
transmission. Lastly, observed from the GEDP measurements, with the
SMP mode, there is an extra 0.5 ![]() overhead associated to
it due to the locking mechanism for integrity control.
overhead associated to
it due to the locking mechanism for integrity control.
When examining the ![]() parameter in Figure 3.1(b),
we find that the cost associated to this parameter is proportional
to the message size, and the memory copy overhead is higher than that
in the case of the
parameter in Figure 3.1(b),
we find that the cost associated to this parameter is proportional
to the message size, and the memory copy overhead is higher than that
in the case of the ![]() parameter. This reflects the different
nature of the memory copy operation. For example, in the microbenchmark
test of the
parameter. This reflects the different
nature of the memory copy operation. For example, in the microbenchmark
test of the ![]() parameter, the involved memory copy operation
is a
parameter, the involved memory copy operation
is a ![]() operation, while for the
operation, while for the ![]() parameter,
it involves a
parameter,
it involves a ![]() operation. Besides, we find that the
SMP kernel has an extra 20
operation. Besides, we find that the
SMP kernel has an extra 20 ![]() overhead added on to the GEDP-SMP,
while both GEDP-UP and FEDP-UP have similar performance.
overhead added on to the GEDP-SMP,
while both GEDP-UP and FEDP-UP have similar performance.
Besides the SMP overhead, we also observe that the current architecture
of this Gigabit Ethernet adapter has a limitation on the achievable
performance. Due to the lack of intelligence network processor, incoming
messages are not delivered to the user process directly. Instead,
they are moved by the DMA engine to a pre-allocated network buffers
area. This requires an extra memory copy done in the interrupt handler
to deliver the messages to the destined user process. The one-copy
cost together with the interrupt overhead (![]()
![]() )
would become a threat to the overall performance, e.g. the total interrupt
cost for a full size packet is 19.7
)
would become a threat to the overall performance, e.g. the total interrupt
cost for a full size packet is 19.7 ![]() under GEDP-UP. This
under GEDP-UP. This
![]() overhead is larger than the theoretical transmission
delay of Gigabit network. Thus, would hinder on the achievable performance.
overhead is larger than the theoretical transmission
delay of Gigabit network. Thus, would hinder on the achievable performance.
There are several methods to work out this problem. First, introduces a network processor to the network adapter such that it can be programmed to move the incoming messages directly to their destined buffers. This approach is taken by other lightweight messaging systems that built on top of Myrinet or Giganet [39], e.g. BIP and FM 2.x. Thus, the interrupt and data movement overheads can be eliminated completely. However, almost all commodity Gigabit/Fast Ethernet cards do not provide the luxury to solve this problem. This is because having a network processor together with the associated SRAM is so expensive that the cost of the memory is roughly half of the production cost. From the commercial point of view, this is not justifiable for improvement of just a few microseconds.
Another method is by the mitigation of interrupt overhead through
multiple packet receptions - interrupt coalescing. Most Gigabit Ethernet
adapters provide a mechanism to perform tuning on the inter-interrupt
gap. For examples, wait until there are x incoming packets
before raise the interrupt signal, or hold off any pending interrupts
until y ![]() has elapsed since handling last packet.
The GAMMA messaging system takes a slightly different approach. Whenever
the network adapter raises the interrupt signal, the GAMMA protocol
blocks off further interrupts by clear the processor's interrupt flag.
By this way, the interrupt handler manually checks on further arrival
of incoming messages and handles them in one shot. But this method
only works under UP kernel. Nevertheless, interrupt coalescing is
useful in cases where packets are arriving in back-to-back, but comes
at the expense of increased per-packet latency.
has elapsed since handling last packet.
The GAMMA messaging system takes a slightly different approach. Whenever
the network adapter raises the interrupt signal, the GAMMA protocol
blocks off further interrupts by clear the processor's interrupt flag.
By this way, the interrupt handler manually checks on further arrival
of incoming messages and handles them in one shot. But this method
only works under UP kernel. Nevertheless, interrupt coalescing is
useful in cases where packets are arriving in back-to-back, but comes
at the expense of increased per-packet latency.
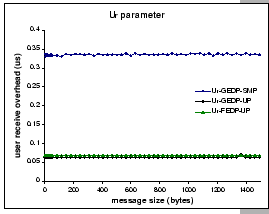
Since the token buffer pool is accessible by both kernel and user
processes, the receiving process can simply check on the TBP for picking
up and consuming the messages. As these are done in the user space,
no kernel events such as block and wake-up signals are needed. Figure
3.1(c) shows the ![]() cost of picking up
a DP message directly from the TBP without any data movement or system
call overheads. Constant overheads, 0.34
cost of picking up
a DP message directly from the TBP without any data movement or system
call overheads. Constant overheads, 0.34 ![]() , 0.06
, 0.06 ![]() and 0.07
and 0.07 ![]() were measured for GEDP-SMP, GEDP-UP, and FEDP,
respectively.
were measured for GEDP-SMP, GEDP-UP, and FEDP,
respectively.
Moreover, ![]() is not necessarily a constant value. With real
communication events, we need to employ another memory copy operation
to move the data from the TBP to the destination buffers. This is
because the TBP is a pre-allocated memory region dedicated for incoming
messages, hence, it does not directly conform to the desire message-passing
semantic. Besides, consecutive messages are stored in TBP, which are
not aligned in contiguous memory region. To re-assemble long message,
one needs to re-construct the message segments back to one large trunk.
Therefore, an add-on
is not necessarily a constant value. With real
communication events, we need to employ another memory copy operation
to move the data from the TBP to the destination buffers. This is
because the TBP is a pre-allocated memory region dedicated for incoming
messages, hence, it does not directly conform to the desire message-passing
semantic. Besides, consecutive messages are stored in TBP, which are
not aligned in contiguous memory region. To re-assemble long message,
one needs to re-construct the message segments back to one large trunk.
Therefore, an add-on ![]() software cost is expected for
each arrived segment. On the GEDP platform, this costs an extra overhead
of
software cost is expected for
each arrived segment. On the GEDP platform, this costs an extra overhead
of
![]() for a 1500-byte packet.
for a 1500-byte packet.
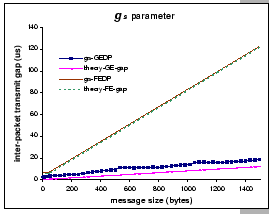
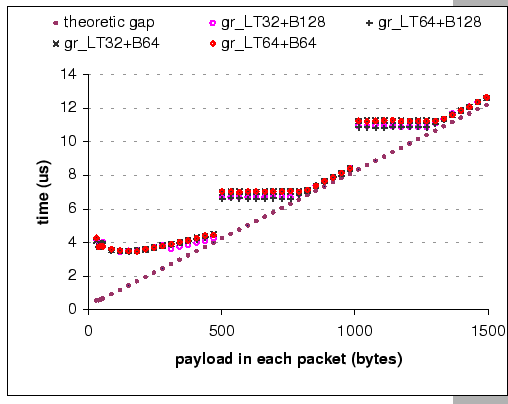
Figure 3.1 (e) and (f) show two other network-dependent
parameters, they are the inter-packet transmit gap ![]() and
inter-packet receive gap
and
inter-packet receive gap ![]() . To justify their relative performance,
all parameters are compared with their theoretical limits. Looking
at the FEDP data, we find that with modern PC or server hardware and
lightweight communication system, we are able to drive the Fast Ethernet
network to its full capacity. For example, the measured
. To justify their relative performance,
all parameters are compared with their theoretical limits. Looking
at the FEDP data, we find that with modern PC or server hardware and
lightweight communication system, we are able to drive the Fast Ethernet
network to its full capacity. For example, the measured ![]() and
and ![]() for m = 1500 bytes is 122.75
for m = 1500 bytes is 122.75 ![]() and 122.84
and 122.84 ![]() , while the theoretical transmission speed
is 123.04
, while the theoretical transmission speed
is 123.04 ![]() . This means that the critical path of the communication
system falls on the Fast Ethernet network.
. This means that the critical path of the communication
system falls on the Fast Ethernet network.
For the Gigabit Ethernet, due to the 10-fold increase in network speed,
limitations within the host machine start to pop up. The graph with
![]() -GEDP data (Figure 3.1e) shows that the
network adapter cannot transmit data in full gigabit performance.
The measured
-GEDP data (Figure 3.1e) shows that the
network adapter cannot transmit data in full gigabit performance.
The measured ![]() value for m = 1500 bytes is 18.76
value for m = 1500 bytes is 18.76
![]() but the theoretical speed is 12.3
but the theoretical speed is 12.3 ![]() . Since
the value of
. Since
the value of ![]() reflects how fast can the network adapter
inject a packet into the network, we clearly see that there exists
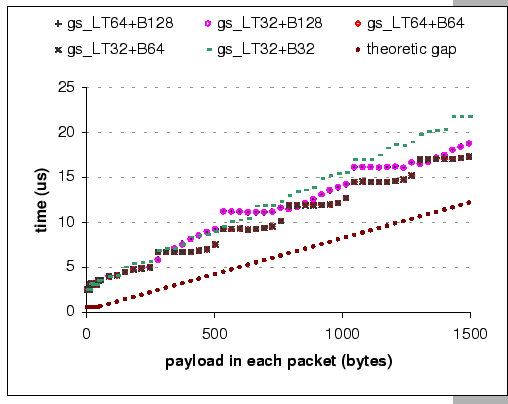
some bottleneck problem. To explore the problem further, we have performed
some investigations on this area, and find that the problem seems
related to the PCI performance, even though our Dell server is equipped
with a 64bit 33MHz PCI bus. It is known that inefficient use of the
PCI bus would result in poor system/network performance [48].
Factors such as the PCI burst size and the PCI latency time are of
the most importance, since they can be directly manipulated by the
system programmer. In our experiments, we varied the burst size and
latency time, and conducted our standard microbenchmarks to measure
the resulting
reflects how fast can the network adapter
inject a packet into the network, we clearly see that there exists
some bottleneck problem. To explore the problem further, we have performed
some investigations on this area, and find that the problem seems
related to the PCI performance, even though our Dell server is equipped
with a 64bit 33MHz PCI bus. It is known that inefficient use of the
PCI bus would result in poor system/network performance [48].
Factors such as the PCI burst size and the PCI latency time are of
the most importance, since they can be directly manipulated by the
system programmer. In our experiments, we varied the burst size and
latency time, and conducted our standard microbenchmarks to measure
the resulting ![]() and
and ![]() values.
values.
|
[Inter-packet transmit gap]
[Inter-packet receive gap]
|
A similar pattern also appears in the ![]() -GEDP data, but
the problem is not as clear as that of the
-GEDP data, but
the problem is not as clear as that of the ![]() parameter.
We find that the measured
parameter.
We find that the measured ![]() value for m = 1024 bytes is
10.6
value for m = 1024 bytes is
10.6 ![]() but the theoretical gap is 8.5
but the theoretical gap is 8.5 ![]() ; on
the other hand, the measured
; on
the other hand, the measured ![]() value for m = 1500 is 12.6
value for m = 1500 is 12.6
![]() while the theoretical gap is 12.3
while the theoretical gap is 12.3 ![]() . Although
we still observe the variation of
. Although
we still observe the variation of ![]() values under different
PCI settings (in Figure 3.3(b)), it appears to be less drastic
than its
values under different
PCI settings (in Figure 3.3(b)), it appears to be less drastic
than its ![]() counterpart, and the measured results look quite
independent of the burst size and latency time. Part of the reason
may be due to the difference in read and write performance of the
PCI bus, in particular, under the Intel 82450NX chipset [49].
For example, the observed throughput for PCI read (from memory) is
approximately 47% less than the PCI write (to memory) throughput
on a 64-bit PCI bus.
counterpart, and the measured results look quite
independent of the burst size and latency time. Part of the reason
may be due to the difference in read and write performance of the
PCI bus, in particular, under the Intel 82450NX chipset [49].
For example, the observed throughput for PCI read (from memory) is
approximately 47% less than the PCI write (to memory) throughput
on a 64-bit PCI bus.
When look at the L parameter (Figure 3.1(d)),
the derived network latency of the GEDP with back-to-back connection
is 6.9 ![]() for a 1-byte message, while the network latency
of the FEDP with back-to-back connection is 9.9
for a 1-byte message, while the network latency
of the FEDP with back-to-back connection is 9.9 ![]() for the
same size message. We observe that the add-on latency by the GE hardware
is much higher than that of the FE, when compare to the theoretical
wire delay for the smallest packet size of the GE and FE, which are
0.67
for the
same size message. We observe that the add-on latency by the GE hardware
is much higher than that of the FE, when compare to the theoretical
wire delay for the smallest packet size of the GE and FE, which are
0.67 ![]() and 6.7
and 6.7 ![]() respectively. In addition,
the time gaps between the network latency measurements with FEDP back-to-back
and FEDP through switch, and between FEDP back-to-back and theoretical
FE speed are almost constant, while the corresponding gaps on the
GE platform seem to be increasing with the message size. This indicates
that there exists some store-and-forward stage(s) along the GE network
path.
respectively. In addition,
the time gaps between the network latency measurements with FEDP back-to-back
and FEDP through switch, and between FEDP back-to-back and theoretical
FE speed are almost constant, while the corresponding gaps on the
GE platform seem to be increasing with the message size. This indicates
that there exists some store-and-forward stage(s) along the GE network
path.
![]()
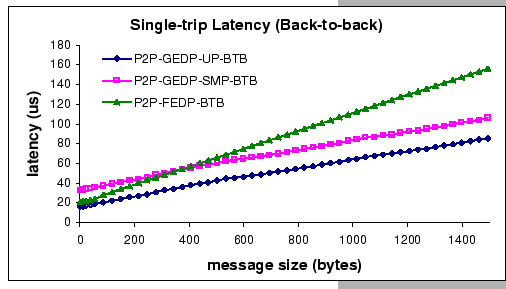
Lastly, Figure 3.2 compares the single-trip latency of
the two DP implementations. To avoid add-on latencies from the switches,
we connect two nodes back-to-back and measure their single-trip latencies.
The GEDP-UP achieves single-trip latency of 16.3 ![]() for
sending 1-byte message, while GEDP-SMP achieves 33.4
for
sending 1-byte message, while GEDP-SMP achieves 33.4 ![]() and FEDP achieves 20.8
and FEDP achieves 20.8 ![]() respectively.
respectively.
From the above analysis, we obtain two sets of performance metrics,
which clearly delineate the performance characteristics of the two
DP implementations. In summary, the host/network combination of the
FEDP implementation has the performance limitation on its network
component. This is being observed by comparing the ![]() ,
, ![]() ,
and
,
and ![]() parameters with the
parameters with the ![]() ,
, ![]() and
L parameters. And since their performance characteristics satisfy
the full-duplex condition, i.e.
and
L parameters. And since their performance characteristics satisfy
the full-duplex condition, i.e.
![]() , we
can directly adopt the previous defined point-to-point communication
costs (Eq. 2.6 & 2.7) whenever we want to
evaluate on its long message performance. Moreover, the host/network
combination of the GEDP implementation has the performance limitation
not falling on the network component. For instance, the
, we
can directly adopt the previous defined point-to-point communication
costs (Eq. 2.6 & 2.7) whenever we want to
evaluate on its long message performance. Moreover, the host/network
combination of the GEDP implementation has the performance limitation
not falling on the network component. For instance, the ![]() parameter is higher than the
parameter is higher than the ![]() and
and ![]() parameters
for both GEDP-SMP and GEDP-UP, which means the performance bottleneck
may fall on this region. Therefore, when predicting their long message
performance, alternate point-to-point communication cost formulae
are required. For example, since the bottleneck stage falls on the
receive phase, the new cost formula for predicting the one-way point-to-point
communication cost of the GEDP-UP implementation becomes:
parameters
for both GEDP-SMP and GEDP-UP, which means the performance bottleneck
may fall on this region. Therefore, when predicting their long message
performance, alternate point-to-point communication cost formulae
are required. For example, since the bottleneck stage falls on the
receive phase, the new cost formula for predicting the one-way point-to-point
communication cost of the GEDP-UP implementation becomes:
In this section, we are going to explore the one-way bandwidth performance of the two DP implementations with respect to different hardware and OS mode. In the analysis, we try to apply the acquired knowledge from the above section to explain and evaluate the measured performance.
Two sets of uni-directional bandwidth measurements for each DP platform
- FEDP, GEDP-UP and GEDP-SMP, are presented in Figure 3.4.
To calculate the raw DP bandwidth, we measure the time spent
in transmitting 10 MB data from one process to another remote process,
plus the time for the receive process to send back a 4-byte acknowledgment.
By subtracting the measured time with the single-trip latency of a
4-byte message, we calculate the achieved bandwidth as the number
of bytes transferred in the test divided by the result timing. As
DP supports unreliable communication only, we have implemented a simple
Go-Back-N protocol on top of DP to provide flow control and support
limited reliable communication. Since all the protocol works are done
in the user space, it has add-on overheads to the ![]() and
and
![]() parameters. For example, the
parameters. For example, the ![]() -GEDP-SMP value
for sending a full load packet is increased from 7
-GEDP-SMP value
for sending a full load packet is increased from 7 ![]() to
12
to
12 ![]() . To calculate the flow-controlled bandwidth of DP,
we performed a set of tests similar to what we have done to obtain
the raw DP bandwidth.
. To calculate the flow-controlled bandwidth of DP,
we performed a set of tests similar to what we have done to obtain
the raw DP bandwidth.
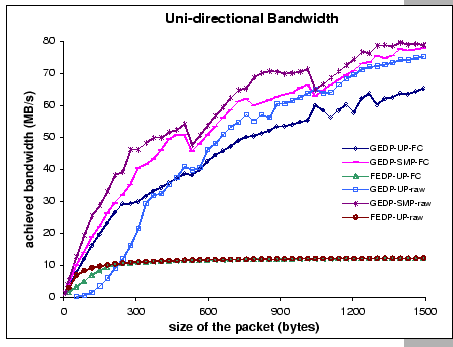
(FC - with flow control on; raw - unreliable mode)
|
From the figure, we see that the maximum achieved bandwidth for GEDP
is 79.5 MB/s, which is the raw DP performance measured under the SMP
kernel. Under the UP kernel, the raw GEDP achieves at most 75.2 MB/s.
Despite the fact that the SMP kernel has a higher ![]() overhead,
it has a better throughput than the UP kernel. This shows the advantage
of sharing the token buffers between the kernel process and user process.
Under the UP mode, the user process can only pick up its arrived messages
after the interrupt thread returns, so the whole interrupt overhead
is included in the delay calculation. However, with the SMP mode,
we have more CPU resources and the user process can check out its
messages even before the interrupt thread returns. This is because
when the receive process gets the CPU cycles and detects that there
are arrived messages, it can immediately consume the shared data.
Besides, due to the large interrupt overhead on SMP kernel, it is
likely that an interrupt thread would pick up more than one arrived
packet. Hence, in long run where packets are arriving in back-to-back,
this effectively amortizes the interrupt overhead across multiple
arrivals.
overhead,
it has a better throughput than the UP kernel. This shows the advantage
of sharing the token buffers between the kernel process and user process.
Under the UP mode, the user process can only pick up its arrived messages
after the interrupt thread returns, so the whole interrupt overhead
is included in the delay calculation. However, with the SMP mode,
we have more CPU resources and the user process can check out its
messages even before the interrupt thread returns. This is because
when the receive process gets the CPU cycles and detects that there
are arrived messages, it can immediately consume the shared data.
Besides, due to the large interrupt overhead on SMP kernel, it is
likely that an interrupt thread would pick up more than one arrived
packet. Hence, in long run where packets are arriving in back-to-back,
this effectively amortizes the interrupt overhead across multiple
arrivals.
For the FEDP, the achieved maximum raw DP bandwidth is 12.2 MB/s,
which is 97% of the Fast Ethernet theoretical performance, while
the raw GEDP-SMP performance only achieves 63.6% of the theoretical
gigabit throughput. This shows that there are limiting factors in
the host machines which hinder the GE performance. We have seen in
Figure 3.1(e) that the network adapter cannot transmit
data in full gigabit performance, by dividing the payload size with
the corresponding ![]() value, we have a useful meter to estimate
maximum performance we can get. Take the value of
value, we have a useful meter to estimate
maximum performance we can get. Take the value of ![]() = 18.7
= 18.7
![]() at m = 1500 bytes as an example, we find that
the maximum transmission throughput is around 80MB/s, which is closely
matched with the GEDP-SMP measurement. Similarly, if we assume that
the bottleneck is on the
at m = 1500 bytes as an example, we find that
the maximum transmission throughput is around 80MB/s, which is closely
matched with the GEDP-SMP measurement. Similarly, if we assume that
the bottleneck is on the ![]() part, let's take the value of
part, let's take the value of
![]() = 19.7
= 19.7 ![]() for m = 1500 bytes, we should
have the transmission throughput bounded by 76 MB/s. Again, this is
closed to the measured performance on GEDP-UP. From these analysis,
we can conclude that the performance of the GEDP is limited by the
for m = 1500 bytes, we should
have the transmission throughput bounded by 76 MB/s. Again, this is
closed to the measured performance on GEDP-UP. From these analysis,
we can conclude that the performance of the GEDP is limited by the
![]() parameter when operates under the SMP kernel, but the
bottleneck is shifted to the
parameter when operates under the SMP kernel, but the
bottleneck is shifted to the ![]() parameter when operates
under the UP kernel.
parameter when operates
under the UP kernel.
To reveal how much improvement we could achieve if we adopt a zero-copy
semantic in the send path, we have done some tests that simulated
a zero-copy send operation, (simply by removing the memcpy()
operation and sending out garbage content). The resulting send gap
(![]() ) is approximately 16.4
) is approximately 16.4 ![]() for m = 1500
bytes, which would correspond to a bandwidth of 91.5 MB/s. By eliminating
the memory copy operation, it should only affect the
for m = 1500
bytes, which would correspond to a bandwidth of 91.5 MB/s. By eliminating
the memory copy operation, it should only affect the ![]() parameter. However, we find that the
parameter. However, we find that the ![]() parameter has changed
too. This simple experiment suggested that the
parameter has changed
too. This simple experiment suggested that the ![]() parameter
is sensitive to other bus activities, since memory copy operation
involves bus transaction on the system bus, which in theory, interferes
with the other data movements on the bus network.
parameter
is sensitive to other bus activities, since memory copy operation
involves bus transaction on the system bus, which in theory, interferes
with the other data movements on the bus network.
With the add-on reliable layer, the FEDP performs almost as good as the raw performance for medium to large-sized messages, which achieves a throughput of 12.1 MB/s. But for the GEDP, the higher protocol overhead does affect the overall performance, especially under the UP kernel mode. Our result shows that under the SMP mode, the maximum achieved GEDP bandwidth with flow control is 77.8 MB/s, with an average drop of 3.4% performance for the packet size ranged between 1K and 1.5K when compared with the raw speed. While for the performance under UP mode, the maximum achieved bandwidth with flow control is 65.2 MB/s and the average performance drop is 13% of the raw speed for the same data range. This further supports our argument that the performance of GEDP-UP is more susceptible to software overheads.
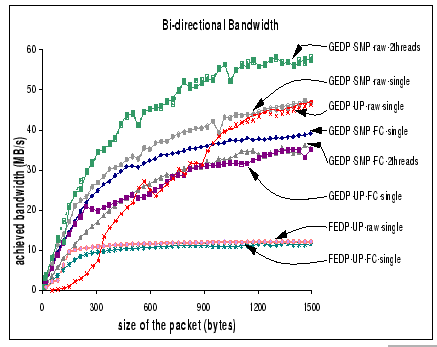
(FC - flow control; 2threads - multi-thread mode;
single - single thread mode)
|
For the GEDP, the best bi-directional performance is observed to be about 58 MB/s per process, which is measured with raw DP using multi-thread mode on SMP kernel. Comparing with the uni-directional bandwidth, we have a performance loss of 22 MB/s, which is a 27.5% drop of the peak point-to-point performance. We attribute this performance loss to the contention on the PCI and system buses as there are concurrent DMA transfers to and from the host memory as well as memory copy operations on both send and receive phases.
When compared with the single thread mode on GEDP-SMP and GEDP-UP, which only achieve 47 MB/s per process, we believe that the software overhead induced in the concurrent send and receive operations is the main cause of this performance loss. Therefore, with the add-on reliable layer that adds more software overhead, it is sensible to see that all GEDP-FC performance suffers more. However, it is surprising to find that the bi-directional performance of GEDP-SMP-FC with multiple thread support is worse than the single thread mode. This performance difference is coming from the extra memory contention and synchronization needed in accessing shared data structures on the reliable layer as both threads are concurrently updating these shared information. Finally, similar to the conclusion as appeared in the uni-directional benchmark, the performance of the FEDP on bi-directional communication has achieved a near-optimal result, which attains 12.1 MB/s per process on the raw bandwidth, and 11.7 MB/s per process with the add-on flow control support.